



















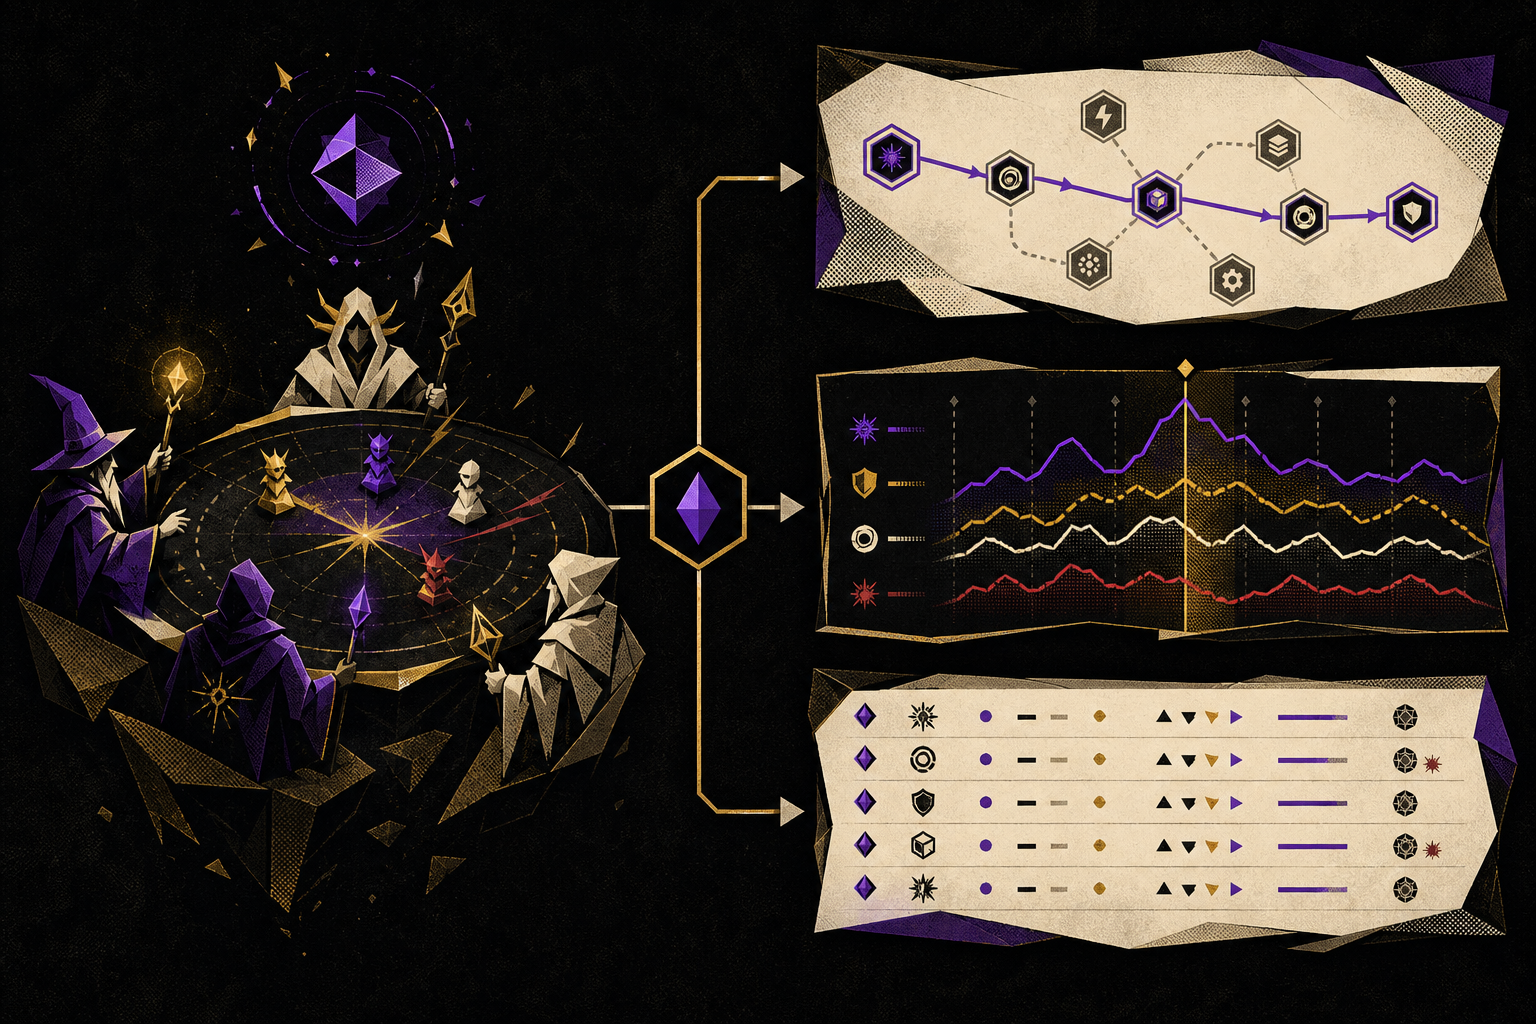
RGS observability connects a player-visible game round to the services, versions and decisions that processed it. The practical model uses traces for one request path, metrics for aggregate behavior and structured logs for detailed events, with shared correlation and strict limits on sensitive data.
OpenTelemetry treats traces, metrics and logs as distinct signals. They answer different questions. A trace explains where one operation spent time; a metric shows whether latency or errors changed across many operations; a log records a discrete event with enough context to investigate it. Copying the same high-cardinality payload into all three is expensive and unsafe.

Define the round lifecycle before instrumenting services
Observability should begin with the domain state machine. Name the points a round can reach: requested, validated, accepted, outcome committed, wallet settled, presented, recovered or rejected. The exact states depend on the platform contract, but each transition needs one owner and an idempotent or compensating behavior.
Then map service spans and events onto those states. This prevents a common failure in which infrastructure reports every HTTP request as successful while a business operation remains pending. A 200 response is not proof that the round reached its final domain state.
Keep correlation identifiers separate by purpose. A trace ID follows one distributed operation. A round ID identifies a domain object. A session ID groups related play. They may be linked, but treating them as interchangeable makes retries and asynchronous settlement difficult to understand.
Trace the path with bounded, stable attributes
Create a root span at the trusted edge or RGS entry point and propagate context through wallet, outcome and persistence calls. The W3C Trace Context Recommendation standardizes traceparent and tracestate headers so independently implemented services can forward a common trace identity.
Span names should describe a stable operation, such as round.validate or wallet.debit, rather than including player, game or round values. Put approved low-cardinality dimensions in attributes: service version, environment, operation, result class and integration name. Record exceptions and error status without copying full request bodies.
Sampling needs a deliberate policy. Head sampling makes an early decision and controls cost; tail sampling can retain traces after seeing latency or errors but requires more infrastructure. Preserve rare failure classes and recovery paths while ensuring normal traffic remains represented enough to compare behavior.
Use metrics for trends, not individual investigations
The first RGS metrics should cover traffic, errors and latency. Prometheus recommends this pattern for online-serving systems in its instrumentation guidance. Add domain counters or observable states where they support an action: accepted rounds, validation rejections, pending settlements and recovered interruptions.
Keep label values bounded. Game family, service version, response class and environment can be controlled vocabularies. Player IDs, raw URLs, round IDs and arbitrary error messages create a new time series for nearly every event. OpenTelemetry’s metrics guidance warns that high cardinality increases memory and processing costs.
Choose histogram boundaries that match operational decisions and report percentiles from an aggregation designed for them. An average can remain stable while a small group of players experiences severe tail latency. Segment only by dimensions with a known diagnostic or release purpose.
Make structured logs useful and privacy-aware
Structured logs should use a versioned event schema. Include timestamp, severity, event name, service and build version, environment, domain state, and approved correlation fields. OpenTelemetry’s logs data model defines TraceId and SpanId fields that connect a log record to the active trace.
Do not log full tokens, credentials, raw payment data or entire request bodies. Hashing an identifier is not automatically anonymization when the value remains stable and linkable. Define allowed fields with security and privacy owners, apply retention by data class and restrict access to the smallest operational group.
Log state transitions once at the service that owns them. Repeating the same event at every layer creates apparent duplicates and complicates incident counts. Infrastructure libraries can record request mechanics while the domain service records the authoritative change.
Alert on player-visible symptoms and stuck states
An alert should correspond to an action. Useful examples include a sustained increase in round rejection rate, settlement latency exceeding a declared service objective, growth in a pending-state queue or failure of the recovery path. Each alert needs an owner, evidence link, severity rule and response procedure.
Avoid paging for every exception. Retries and rejected invalid requests can be normal within a bounded rate. Alert on the symptom across a meaningful window, then use exemplars or links to representative traces for investigation.

Run synthetic canary rounds or non-wagering health transactions only where the platform contract safely supports them, and keep them unmistakably separated from production player activity. A shallow /health endpoint cannot prove that downstream settlement and presentation paths work.
Make instrumentation part of the release contract
Telemetry schemas change with software. Version dashboards and alerts alongside services, verify required attributes in integration tests and ensure a new release still connects its client, RGS and downstream spans. A successful deployment without usable telemetry is an operational regression.
The observability plan should support resilient casino game sessions once that recovery contract is implemented: reconnect attempts, duplicate suppression and final-state restoration need domain signals rather than generic network errors. It also gives casino game development teams evidence for a controlled rollout instead of relying on support reports after a failure spreads.
Measure the observability system itself. Dropped spans, exporter failures, delayed logs and metric-cardinality growth can remove evidence precisely when traffic is under stress. Capacity and privacy controls are part of the production design, not post-launch housekeeping.
Frequently asked questions
What is RGS observability?
RGS observability is the ability to understand a remote game server from its emitted traces, metrics and logs. It should connect a player-visible round to the services, versions and decisions that processed it without exposing unnecessary personal data.
What should a casino game round trace contain?
A round trace should contain bounded spans for the request path, stable service and version attributes, timing, status and approved correlation identifiers. Sensitive wager or player data should not be copied into span attributes.
Which RGS metrics are most useful?
Start with request or round volume, errors and latency, then add domain states such as accepted, rejected, pending and recovered rounds. Keep labels low-cardinality so the metric system remains predictable.
Should player IDs be metric labels?
No. Player IDs create unbounded cardinality and unnecessary privacy exposure. Use controlled dimensions for metrics and keep approved identifiers in access-controlled logs or trace links only when operationally required.
How do logs connect to distributed traces?
Include the current trace and span identifiers in structured log records. OpenTelemetry defines fields for this correlation, allowing an operator to move from an alert to a trace and then to relevant events.
What makes an RGS alert actionable?
An actionable alert names the affected service or round state, uses a sustained symptom, links to evidence and has an owner and response procedure. Alerts on every individual exception create noise rather than reliable incident detection.