






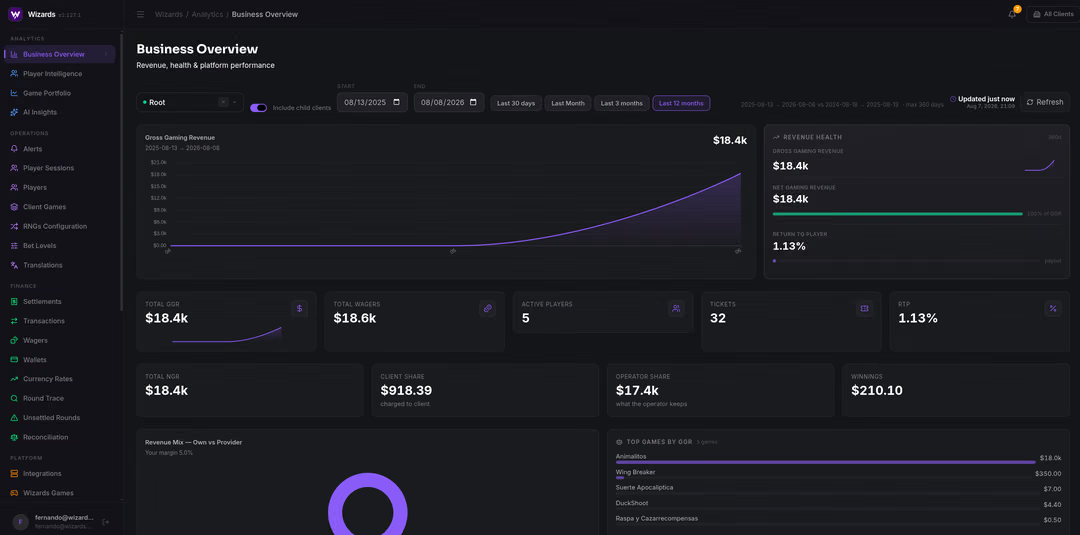
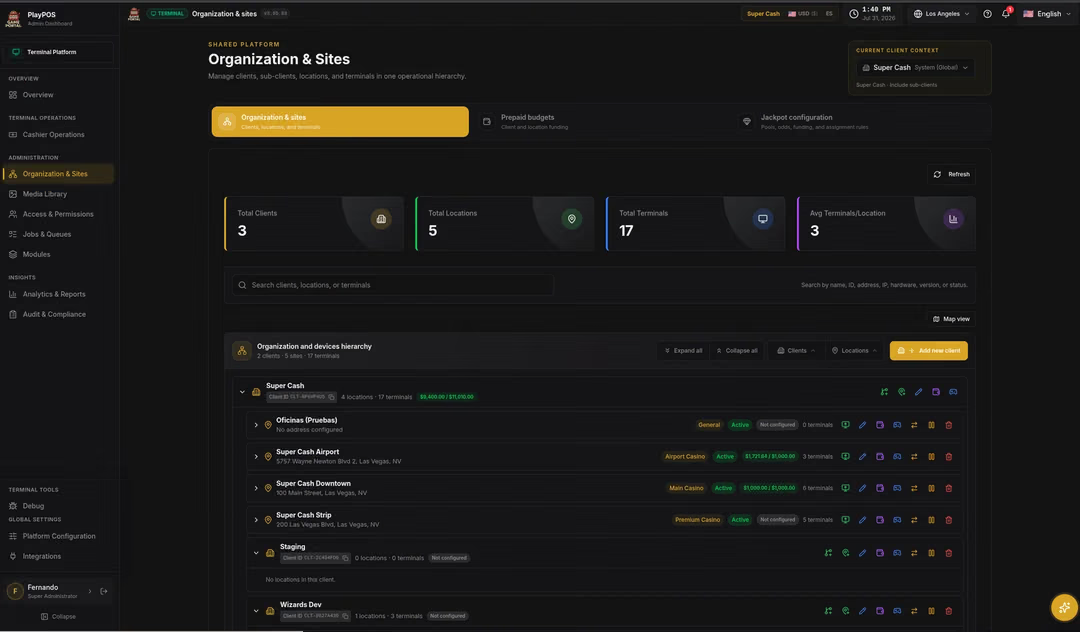













The house edge is the percentage of each wager an operator retains over the long run: the mathematical inverse of RTP built directly into every game’s design. For operators and developers, it is not a hidden tax but a precision instrument that drives sustainable revenue.
Getting that calibration right is one of the most consequential decisions in game development. Set the margin too high and you accelerate player churn; too low and your platform bleeds. The sections below walk through the math, the design implications, and how to manage it across a full portfolio.
The mathematical foundation of house edge and RTP

House edge is the inverse of the Return to Player (RTP) percentage. The formula is straightforward: House Edge = 100% − RTP. A slot certified at 96% RTP carries a 4% edge, meaning the platform retains, on average, $4 of every $100 wagered over a large sample of bets.
A second calculation matters for forecasting: expected hold = wager × house edge. Feed that into volume projections and you get your theoretical GGR before a single spin is played.
Short-term variance will move daily revenue above or below that line. Over a sufficiently large sample, actual performance converges with the certified mathematical model. That convergence is why the design-phase decision on edge is so consequential for long-term financial planning.
How house edge shapes game design and player psychology
Players rarely perceive the edge as a raw percentage. What they feel is volatility and hit frequency. Designers frequently use a high hit frequency (frequent small wins) to sustain engagement on titles with a higher margin, extending session length and maximizing lifetime value.
The strategic tension is between aggressive margins and retention. A title that feels “tight” accelerates churn and damages brand sentiment. The most successful games embed the house advantage inside engaging bonus mechanics so players experience entertainment value even when the math is working in the operator’s favor.
For a detailed breakdown of how these mechanics interact, the slot machine math model covers the full relationship between RTP, volatility, and player behavior.
House edge by game type: typical margins for operators
Understanding the typical range by category is essential when building or auditing a portfolio. These figures reflect standard conditions; actual values depend on the specific math model and jurisdiction (as of 2026, under widely adopted industry standards):
- Blackjack — ~0.5% with optimal player strategy; rises significantly with sub-optimal play.
- Baccarat (banker bet) — ~1.06%, one of the lowest across all table categories.
- Craps (pass line) — ~1.4%, a highly predictable margin with strong player retention.
- European roulette — ~2.7% (single zero); American roulette ~5.26% (double zero).
- Video poker (optimal play) — ~0.5–2% depending on variant and paytable.
- Slots — typically 3–7%, though premium titles and jackpot-linked games vary widely.
- Keno — 20%+, reflecting the lottery-style nature of the game.
These ranges inform portfolio composition. A lobby anchored in table games attracts skill-oriented players and signals fairness; one weighted toward slots maximizes GGR per active session. Most operators blend both deliberately.
Strategic portfolio management and balancing margins across game categories
A sophisticated iGaming lobby requires a diversified mix of margins to capture different player segments and stabilize the overall win rate. Table games with sub-1% edges serve as powerful acquisition tools, drawing high-value players who generate significant volume even at lower margins.
Vertical integration within the portfolio allows operators to offset the high variance of certain titles with the steady, predictable margins of others. Managing this mix requires constant auditing of performance across every game category. A well-structured gambling software platform surfaces these analytics natively, making it far easier to rebalance the mix without manual data extraction.
- High-margin slots — Primary revenue drivers due to rapid gameplay cycles and broad player appeal.
- Skill-based table games — High retention and prestige; attract experienced players who generate volume despite lower margins.
- Aggregated third-party content — Enable rapid portfolio scaling while maintaining a balanced average edge across the full lobby floor.
Product leads must track how these categories interact. A lobby too weighted toward low-margin games may struggle to cover acquisition costs; one too aggressive risks losing its active base to more competitive platforms.

Certification and compliance risks in mathematical models
The house edge is not merely a business choice; it is a regulated specification. Independent testing laboratories such as GLI and eCOGRA audit the Random Number Generator (RNG) to confirm the live game behaves exactly as certified.
That certification work is typically executed at the remote gaming server (RGS) layer, where the mathematical model runs in production. Any deviation between certified math and live performance can trigger regulatory fines or license suspension.
A recurring compliance risk is the temptation to “tighten” games post-launch by adjusting parameters to boost short-term revenue without re-certification. In most regulated jurisdictions this constitutes a direct violation of transparency requirements. Operators relying on game testing and certification partners maintain a consistent, auditable mathematical record that protects both their license and player trust.

Predicting Gross Gaming Revenue from house edge and betting volume
For finance and executive teams, Total Handle × House Edge is among the most reliable GGR forecasting formulas available. Understanding how Gross Gaming Revenue (GGR) behaves in practice allows CFOs to build quarterly projections, allocate bonus budgets, and size marketing spend against expected mathematical yields.
Several variables can shift actual hold away from the theoretical line: bonus abuse, sophisticated betting patterns, and statistical variance in high-volatility titles. Standard practice is to run regular reconciliation audits comparing the certified edge against the actual monthly hold. Persistent deviations beyond expected variance often indicate a technical fault, a configuration error, or an anomaly that warrants immediate investigation.
Optimizing the house edge for sustainable growth
The target is a margin high enough to ensure profitability but competitive enough to sustain an engaged player base. Operators who treat mathematical modeling as a core product discipline, not a backend afterthought, tend to outperform those who set it once and move on.
As the industry shifts toward data-centric operations, the ability to refine edge parameters based on live player behavior becomes a meaningful competitive advantage. Precise, certified math foundations make it substantially easier to scale into new regulated markets without disrupting the revenue model in existing ones.
If you’re designing or reviewing the mathematical model behind your casino games, our team at Wizards can help you calibrate margins, prepare for certification, and build a portfolio that holds up under regulatory scrutiny. Reach out to explore how we approach casino game development from the math layer up.
Frequently asked questions about house edge
How is the house edge calculated from RTP?
House edge is the inverse of the Return to Player percentage: house edge = 100% − RTP. A slot certified at 96% RTP therefore carries a 4% edge, meaning the platform retains on average four dollars of every hundred wagered across a large sample of bets. The forecasting form of the same figure is expected hold = wager × house edge, which turns a volume projection into a theoretical GGR before a single spin is played.
How do operators distinguish between the theoretical margin and the actual monthly hold?
Operators monitor the gap between the certified mathematical advantage and real-world performance through a process called hold reconciliation. While the theoretical house edge remains static, the actual hold fluctuates based on betting volume and short-term variance. Significant long-term deviations often signal issues like technical glitches, incorrect game configuration, or sophisticated bonus abuse. Consistently tracking this metric allows teams to verify that the Random Number Generator (RNG) is operating within its certified parameters, ensuring financial projections remain accurate despite daily statistical noise.
What are the warning signs that a game mathematical model requires urgent re-evaluation or auditing?
The most common red flag is a persistent deviation between the theoretical and actual GGR that exceeds the expected standard deviation over a high volume of bets. Beyond simple variance, operators should look for anomalies in specific player segments or suspicious betting patterns that might exploit mathematical loopholes. If a title consistently yields returns far outside its certified volatility index, it may indicate a flaw in the game logic or an unauthorized change in the software environment, necessitating an immediate independent audit to mitigate regulatory risks.
How do regional regulatory caps on RTP impact the strategic design of an international casino portfolio?
Different jurisdictions impose strict minimum or maximum limits on the Return to Player percentage, which directly dictates the permissible house edge. For operators scaling globally, this requires a modular approach to game mathematics. A title that performs well in a low-regulation market might need its math model re-certified to comply with the tighter margins required in strictly regulated regions. Failing to adapt these mathematical configurations can result in rejected licenses or a loss of competitive edge against local operators who have optimized margins for that specific legal framework.
What is the relationship between game volatility and the long-term stability of the house edge?
While volatility determines the frequency and size of payouts, it does not change the house edge itself. High-volatility games produce more dramatic revenue fluctuations, requiring operators to maintain larger cash reserves to cover potential big wins. Conversely, low-volatility titles provide more predictable, steady margins. Product managers must balance these mathematical profiles across their lobby to ensure that the aggregate variance does not jeopardize the platform liquidity. Understanding this relationship is vital for managing cash flow and setting realistic expectations for stakeholders regarding monthly revenue stability.
Which casino game categories typically carry the lowest house edge?
Table games generally offer the lowest margins. Blackjack with optimal strategy sits around 0.5%, and baccarat’s banker bet runs approximately 1.06%. Craps on the pass line is close to 1.4%. These figures assume standard rules and, in the case of Blackjack, skilled play; the effective hold for the operator is typically higher when average player decisions are factored in. Slots and keno sit at the higher end of the spectrum, which is why a well-balanced lobby mixes categories rather than concentrating in any single type.