






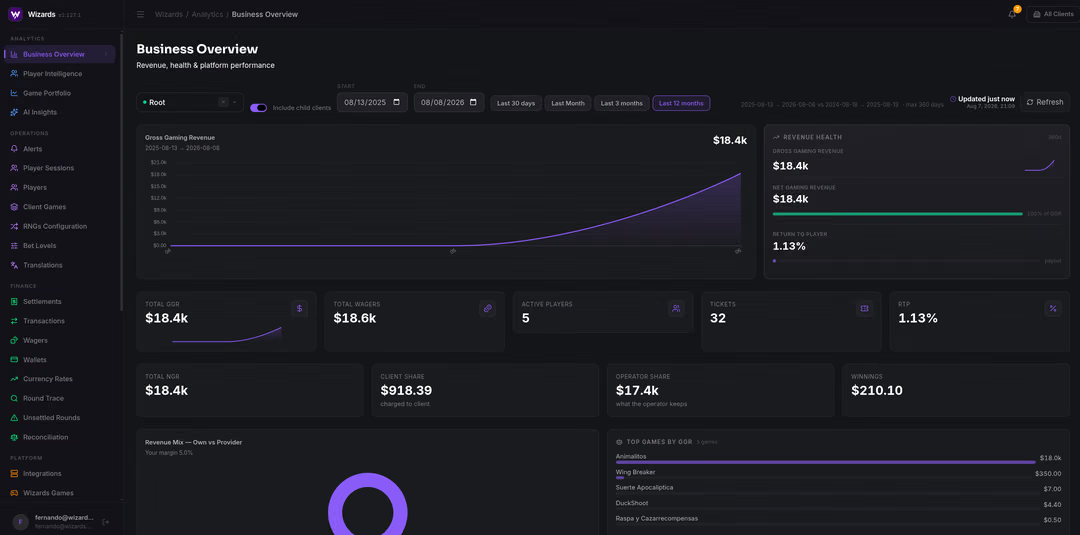













Gross Gaming Revenue (GGR) is the amount an operator retains after paying out player winnings: total wagers placed minus total winnings returned. It is the industry’s standard measure of top-line performance before bonuses, taxes, or operating costs are deducted.
For any operator or platform team, GGR is the first number on the reporting chain. It tells you how much your games are generating at the product level, and it sets the baseline for every downstream financial decision your business makes.

How the GGR formula works and what it actually measures
The GGR formula is straightforward: GGR = Total Wagers – Total Winnings Paid. If players collectively stake $10 million and receive $9.2 million back in winnings, the operator’s GGR is $800,000. That $800,000 represents the raw yield of the gaming product before any costs touch it.
This figure does not equal profit. It is the commercial output of the house edge applied across all player activity. A casino with a high gross number may still operate at a loss if its bonus spend, tax rate, or platform fees are disproportionate to what the games are retaining.
Industry stakeholders use the metric as a standard volume benchmark because it enables direct comparisons across jurisdictions, product types, and competitors. It answers one specific question: how much did the games produce? Everything beyond that requires moving to NGR.
GGR vs. NGR: the formula difference that determines actual viability
Net Gaming Revenue (NGR) is what remains after stripping the direct costs from GGR: NGR = GGR – Bonuses – Regulatory Taxes – Platform Fees – Loyalty Costs. This is the figure that determines whether an operation is financially viable, not the gross number most press releases lead with.
The gap between GGR and NGR varies significantly by market. In heavily taxed jurisdictions or during aggressive acquisition campaigns, that gap can consume 40-60% of gross revenue. The key deduction categories operators need to track are:
- Bonus costs — The value of free bets and promotional credits that generate turnover without putting the operator’s margin at risk.
- Regulatory taxes — Mandatory levies to local authorities, typically calculated as a percentage of GGR (varies by jurisdiction and is subject to change).
- Platform fees — Royalties paid to software providers for game content and backend systems, usually a percentage of gross or net revenue.
- Loyalty incentives — Cashback and reward programs that return value to high-volume players over time.
An operator can show strong GGR growth while NGR is flat or declining. That divergence is a warning signal: it usually means bonus costs or taxes are rising faster than the top line. Teams who track only the gross number often discover the problem too late.
Smart teams use the GGR-to-NGR conversion rate as a standing efficiency KPI. When that ratio deteriorates quarter over quarter, it triggers a review of bonus structures, game mix, and tax exposure before the margin problem becomes structural.
How GGR shapes regulatory compliance and tax reporting
In most regulated markets, GGR is the taxable base for gambling duty, not total turnover and not NGR. Regulators prefer this approach because it reflects the income the operator actually retains, producing a tax burden proportional to real revenue rather than betting volume.
Compliance officers must ensure the data pipeline from game server to financial ledger is fully auditable and tamper-proof. Discrepancies in GGR calculations, even technical errors like unsynced voided transactions, can trigger audits, financial penalties, or license suspension.
As of mid-2026, regulators in jurisdictions such as Malta (MGA) and the UK (UKGC) treat reporting integrity as a core licensing condition. Requirements vary by market and are subject to change; always verify current obligations directly with the relevant authority.

Accurate GGR reporting also protects commercial relationships. Payment processors and casino game aggregator partners increasingly require clean, auditable revenue data as a condition of integration. An operator with a documented record of precise reporting faces significantly fewer friction points during partner onboarding or license renewal.
Using GGR as a performance benchmark for game portfolio and marketing ROI
At the product level, GGR reveals which game titles or categories are actually generating yield, not just traffic. By comparing GGR per game against lobby placement costs, product teams can make evidence-based decisions about which titles earn prime real estate and which are underperforming their theoretical RTP.
Marketing teams apply the same logic to acquisition. If a campaign drives high wagering volume but the players it brings in cluster around low-margin titles, the top-line number looks healthy while ROI is poor. Aligning iGaming marketing spend with revenue benchmarks per cohort surfaces that mismatch before budget is wasted at scale.
There is also a volatility dimension worth tracking. A single high-roller on a lucky streak can inflate the figure for a reporting period without reflecting the true yield of the game library.
Over a large enough transaction sample, GGR should converge with the weighted theoretical RTP of the active portfolio. Persistent deviations are worth investigating: they can indicate game logic issues or fraud patterns that need immediate attention.

The role of platform technology in GGR reporting accuracy
GGR is only as reliable as the system that generates it. Legacy batch-processing architectures introduce reporting lag, sometimes hours, between betting activity and back-office visibility. That delay makes it impossible to respond quickly to shifts in player behavior, bonus abuse patterns, or sudden game-level anomalies.
Modern iGaming platform software consolidates wager and payout data in real time, giving the CFO and CMO a single source of truth rather than competing spreadsheets. Automated bonus management within the same system reduces the manual reconciliation that historically caused reporting errors.
For operators evaluating infrastructure upgrades, the deciding factor is usually the gap between wagering events and auditable records. When that gap requires manual intervention to close, the platform is creating compliance risk, not just operational friction.
Working with established iGaming platform providers who offer real-time back-office reporting significantly reduces that risk as transaction volumes scale.
What GGR tells you and where it stops
GGR is the right starting point for any financial conversation about an iGaming operation. It measures product performance cleanly, without the noise of operational costs or marketing decisions. For regulators, investors, and board-level reporting, it is the most comparable and universally understood metric in the industry.
Its limit is equally clear: the gross figure alone cannot tell you whether the business is profitable or whether growth is sustainable. That answer lives in NGR and the margin between the two.
Operators who internalize this distinction and build reporting infrastructure to track both metrics accurately are the ones who scale with confidence rather than discovering cost problems after the fact.
If your team is building or upgrading the reporting stack that connects GGR to NGR and operational profitability, we work with operators at that layer. Reach out to explore what the right platform setup looks like for your business.
Frequently asked questions about GGR in gambling
What is the difference between GGR and NGR?
GGR is total wagers minus total winnings paid: the raw yield of the gaming product before any cost touches it. NGR is what is left once the direct costs come out — bonuses, regulatory taxes, platform fees and loyalty costs — and it is the figure that says whether an operation is financially viable. The gap between the two varies by market, and it widens in heavily taxed jurisdictions and during aggressive acquisition campaigns.
Can an operator have high GGR but still face financial instability?
Yes, and it is more common than it appears. High GGR can mask aggressive bonus spend, rising tax rates, or heavy platform fee structures that erode the net margin. If the GGR-to-NGR conversion rate is poor, the operation may be unsustainable despite strong betting volumes. Evaluating the quality of revenue, not just the quantity, is what separates operators who scale profitably from those who grow into a cost problem.
What are the most common GGR reporting errors that create compliance risk?
The most frequent issues stem from data synchronization failures between the game server and the back-office ledger. Voided transactions that are not properly excluded, or game-level deductions required by local regulators that are applied inconsistently, are common sources of discrepancy. These errors can lead to incorrect tax filings and trigger regulatory scrutiny. A single auditable source of truth across all channels is the most reliable protection against this category of compliance risk.
How does house edge affect GGR across a mixed game portfolio?
Each game’s theoretical Return to Player (RTP) determines how much of each wagered dollar returns to the player over time, and the remainder becomes GGR. A portfolio weighted toward high-RTP titles will require greater wagering volume to produce the same GGR as one with lower-RTP games. Product teams that track GGR by game category can rebalance their lobby to optimize overall yield without relying solely on acquisition volume to hit revenue targets.
Why do regulators use GGR as the tax base rather than total player turnover?
Taxing total turnover would be disproportionate for most operators, since the large majority of wagered funds are returned to players as winnings. GGR represents what the operator actually retains, making it a more proportional and operationally sustainable base for duty calculations. Most regulated markets, including Malta and the UK, use a GGR-based framework, though the applicable rate and exact calculation method vary by jurisdiction and can change with regulatory reform.
How do you calculate gross gaming revenue for a multi-product operation?
For a multi-product operation, GGR is calculated separately by product line (slots, live casino, sportsbook, and so on) and then aggregated. The formula is the same at every level: total wagers minus total winnings paid out. What changes is the reporting architecture required to capture accurate data across products that may run on different game engines or platforms. Consolidating all product lines into a unified back-office is the standard approach for operators managing more than one vertical.